This week I’m back from NAVSA. Well — not really back; it was just up the road in Pasadena. But I expect to spend some time nursing this (intellectual) hangover and thinking of the talks that I saw and the questions that were raised there.
Most immediately, it’s clear that digital work has hit the pavement in 19th century studies. Natalie Houston gave a fantastic talk about her “Visual Page” project, which uses Google’s tesseract OCR reader to analyze formal elements in a print corpus of Victorian poetry. It was stunning how much a computer can learn about a poetry collection just from the blank spaces on the page. Maeve Adams gave an intriguing paper that read across key terms in Victorian periodicals as “epistemic communities” and used this to ground a far-reaching argument about formalism in the 19th-century. And Rachel Buurma expanded on her work on Charles Reade and his archives — an eccentric even among archive rats. As she put it, his wildly profuse collections of documents, indexes, and indexes on indexes, add up to archives “on the way to becoming novels.” I’m almost convinced to read more Reade. It doesn’t sound like he would have appreciated YAHOO (I read the marginalia as: “In other words know the contents before you know anything about this”):
On Saturday I participated in a digital roundtable that Anne Helmreich of the Ghetty Foundation organized to field questions about research and pedagogy from conference attendees. The Prezi from my own talk, about some of the tools I’m using in class, (using Facebook as a social CMS and Google Drive for workshops) is posted here. My main point was that English seminars have always been “flipped”: focused on in-class workshopping and intellectual tinkering. Which makes it easy to fold in digital tools. (I take my inspiration here from Jentery Sayers and his Maker Lab.) But I was more interested in hearing what the other panelists and the attendees had to stay about the state of the digital union with C19 studies.
Most questions raised by the participants were about the ins and outs of digital scholarship: how to recruit technical collaborators (find research questions they’re interested in); how to find time and money for the work (no good answer there); how to use statistics (to be avoided while best standards are worked out); how to use undergraduate research more effectively (give them work that is tied to your own research + break projects into discrete chunks). This last point was made by Dermot Ryan, current Undergraduate Research Director at Loyola Marymount. I suspect the dismal statistics for undergraduate research conducted in the humanities at LMU would be matched at USC. It’s a thorny problem. I’ve been thinking about ways to pull undergrads in to my next digital research project. But as I focus on finishing my analogue book, there’s not much I can think of sending undergraduates out for, besides checking references. Clearly this is a problem with hermetic patterns of research. In order to frame more collaborative projects we have to hash research questions into practices that depend less on our own idiosyncratic habits of mind and the idiolects of convenience. We (or at least, I) need to be better at looping others in.
It was also a huge pleasure to meet Petra Dierkes-Thrun and learn more about the “Wilde Decadents” class she’s running at Stanford and its blog. The class generated tremendous interest; the work the students produced was read by visitors from across the globe. I’m frankly envious. She was particularly savvy promoting the course and its Twitter account through academic networks and listserves like the Victoria List.
But perhaps the most intriguing contribution to the roundtable, to my mind, was Andrew Stauffer’s diagnosis of the NINES project. NINES is currently working to redefine itself to better serve the current wave of digital scholarship. As Andrew described it, NINES was originally envisioned as a coordinator and peer-review network for online collections produced by academics — sites like the Rossetti Archive, the Woman Writer’s Project, and Darwin Online. They envisioned an academic internet populated by public research archives. Instead the major commercial publishers and Google have digitized masses of texts and placed them behind paywalls. Gale’s NCCO database is a case in point. A corollary challenge is that NINES’ COLLEX originally provided a solution to the basic problem of finding a CMS to furnish different kinds of academic content. But the widespread adoption of other open source CMSs like OMEKA diminishes the case for further investment in COLLEX. The folks at NINES are now trying to figure out how else they might support digital research — for instance, producing new tools for digital analysis along the lines of DocuScope. I’m looking forward to their public launch of Juxta, which produces a visual codex for textual variants. There’s an undergraduate who’s been asking for a good tool to start DH work with and this looks friendly enough to be promising. Andrew also suggested NINES might start convening seminars which bring humanists and engineers together to test new research avenues. It would be exciting to have an interdisciplinary research seminar that was formatively tied to a technical team rather than an academic department — tied to makers as well as thinkers.
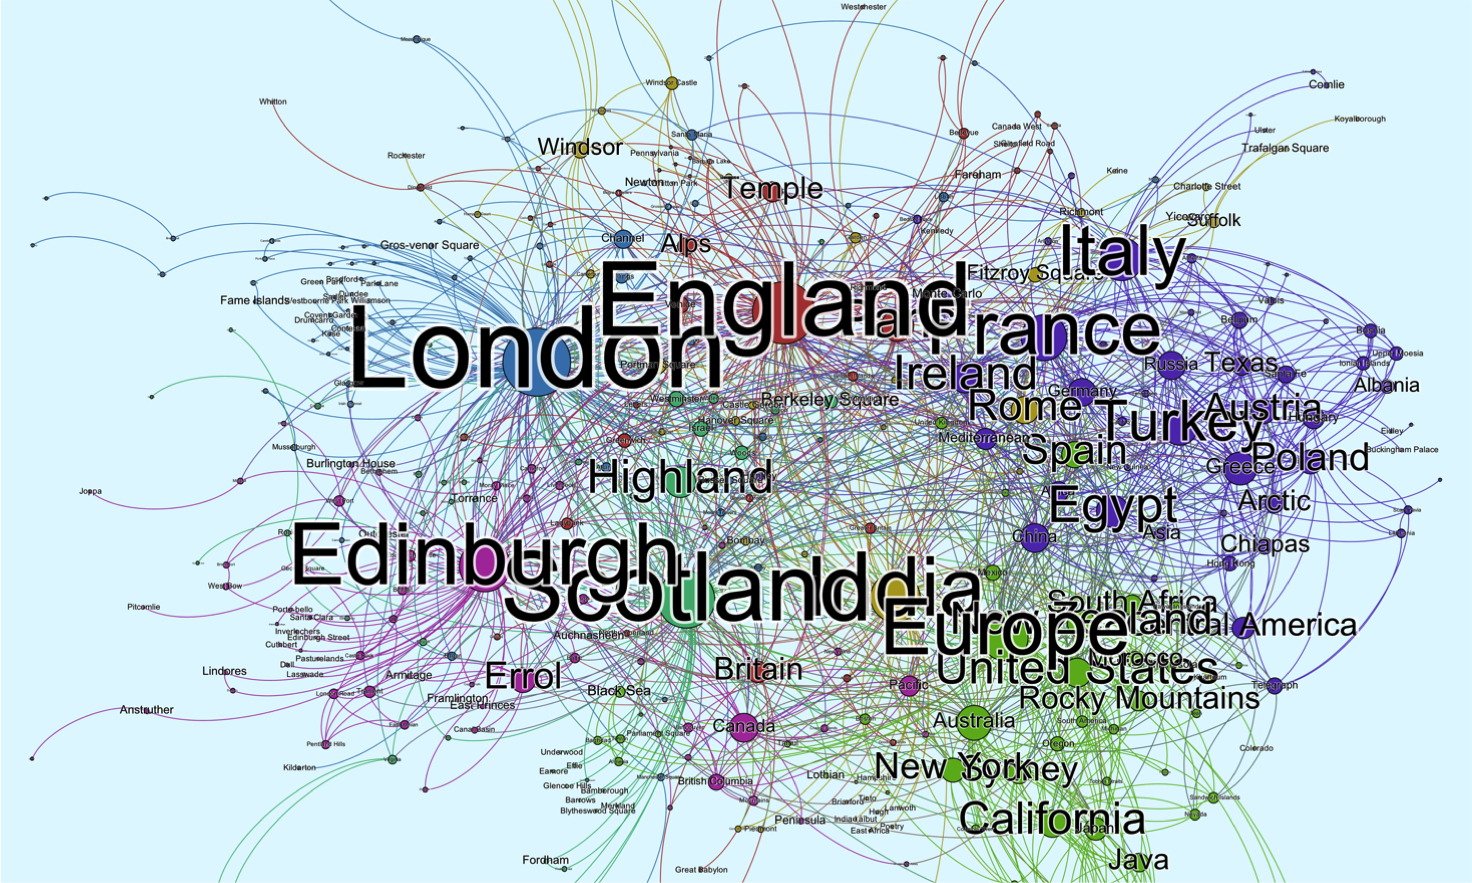
At its heart, NINES is a classic disruption story. It announced a new chapter in 19th-c scholarship when it was launched in 2003 — the same year as NAVSA’s first conference. Both organizations are now at a crossroads (Dino Felluga handed his role as NAVSA’s head and to Marlene Tromp on Saturday). Given the rapid change of our technical tools, no organization or project that locates itself in the digital sphere will we able to avoid a regular reinvention. I spent a considerable amount of time getting the Monk project software up and running for an early experiment with my Darwin analysis. I invested even more time figuring out the Meandre suite, including a trip up to the UVic digital workshop, with hours both in person and via email, drawing on the expertise of Loretta Auvil and Boris Capitanu. That culminated in a single talk at the Seattle MLA on the global network imagined by Oliphant’s novels. The return on investment for this work has been relatively small. And now both Meandre and Monk have exhausted their funding and have begun to recede into history. I’ve just now noticed that “monk-project” is embedded in the permalink for this post — legacy of an early vision for this site.
Like any story, it has been a combination of design and contingency. I’ve been focused on cementing a traditional research profile, using the digital work to keep my hand in, waiting to mount my extended DH project when the book’s off. Each effort has given impulse to that trajectory. It’s still exciting to imagine the tools and methodologies that the next two and ten years will bring. And yet, as I listened to conference attendees ask what it would take to get trained in digital work, how to figure out the appropriate criteria for significance, how to adapt to new technologies — essentially, how to surf a continual revolution — it hit me what DH work signs you up for. A lifetime of fresh tarball installations, cribbed command prompts, endless help pages for new object libraries and bewildering new GUIs. As the tools change we reboot and relearn. We need to be honest about this. Off the top of my head, my current experiments with Python follow upon, in reverse order, exploring Ruby, Java, JavaScript, JQuery and MySQL, XSLT, CSS, VisualBasic, HTML, and TCL (!). This sets aside humdrum life as a sysadmin for OSX, Linux, AmazonAMI, WinXP, MsDos and Unix machines — not to mention WordPress itself. The most rigorous Ph. D. programs require two to three languages, not four or five.
If it sounds like I’m grousing, maybe I am. We need to emphasize the long dead ends as well as the triumphs of DH scholarship when we talk to curious peers. But the big “but” is that, as academics in the humanities, we’re tinkerers by trade — whether on our computers, in the classroom, or at the archive. For my part, I’d be exploring some version of these technologies in any likely case. It’s just so much time wasted stringing zeroes and ones unless I invest this labor in my research. Besides, I want to show my daughter what hacking looks like.